Google Timeline Analysis (Finally Something Useful)
Last year, I had to submit a large form with my travel history outside of UK.
The normie approach would be to sit down with your passport and a large cup of coffee, note down each stamp and figure out when the corresponding flight was - Yuck. Further, the UK doesn’t stamp your passport on the way out, so that leaves you with edge cases (If you arrived in Bangkok on 17th May, did you leave the UK on the 16th or the 17th?) - Such edge cases would have to be resolved by tracking down the corresponding flight ticket in your inbox. Double Yuck.
The Type A personality approach would be to maintain an ongoing spreadsheet of your travel history that you update at fixed intervals (Along with the spreadsheets that track your investments, the expiry dates of all your medications and the last known locations of all your sworn enemies). Triple mega ultra YUCK.
This seemed like a prime opportunity for a datadude revival post. Google has been stalking my physical location for years and it was finally time for me to extract some value from that. I downloaded the relevant files from Google Takeout and I was ready to go.
Takeout Choices - Raw or Processed?
Google gives you your history in 2 formats.
Raw Data: A giant list where each entry is (Point in time, Point in space). This is the physicist’s worldline - Your life is just a discontinuous curve moving through 3-dimensional spacetime (The discontinuities are the times your phone wasn’t online and 3-D because Google maps doesn’t store your spatial z co-ordinate).
The great thing about this format is the data schema is as simple as it can get. This has many advantages, including maximal data portability - Integrating your Google worldline and your Apple Maps worldline is a simple matter of list concatenation.
The bad part is you have to do all the data crunching. There are also some weird issues that crop up when using the raw data - For eg. soon after I moved to the UK, there is a patch in my raw data that shows my physical position as alternating between London and Mumbai. I suspsect this is because I was logged in to my Google account on both, my PC in my parent’s home and my cellphone, and my position was being recorded from both devices simultaneously.
Semantic Format: Here Google uses it’s world-class, cutting edge algos and armies of highly paid data scientists to slap some meaningful labels on the raw worldline data. At a high level, your location history is divided into placeVisits (Where you spend some time stationary at location X) and activitySegment (Where you travel between location X and Y).
Each placeVisit contains information like the coordinates of the place visited, the duration spent there, the address as inferred by Google etc. Each activitySegment has information like the start and end coordinates, the path followed and the inferred mode of transport for that edge.
The problem with these is that the datamodel is complicated and varies over time. For example, in my semantic data, each activitySegment contains a field ‘activities’, which is a probability distribution over the possible modes of transport that activity involved. Now most (But not all) activitySegments also contain a field called ‘activityType’, which is assigned value of the most likely activity in the list. Hence any solution that uses the ‘activityType’ field may miss some information. Without an official dictionary from Google clearly fleshing out what these fields mean, we are forced to rely on our common sense to make sense of these fields, and while that is good enough for most cases, it will certainly not cover all cases.
Further, Google will sometimes fuck up the tagging of activitySegments (like the time they thought I cycled from Lucknow to Mumbai in 2 hours). For the most part however, they are probably doing a better job of cleaning up and interpreting this data than I can.
Approach 1 - Rawdogging data, Costly API calls, Simplifying assumptions
Given the above, it seemed that if we want a Google proof solution (In terms of being immune to both, their sloppy data processing and their potential future bankruptcy from class action lawsuits filed by rock-eaters), the most reliable way is to use the raw worldline. Further, for the task I had in mind, the solution seemed super simple - For each point on the worldline, map it to the corresponding country. Find all the points in time when the country changes and Boom - You have your travel history table.
Problem with this approach: Mapping from (Latitude, Longitude) → Country is an expensive function call. The raw data contains a point every 15-20 seconds, so that translates to a lot of points. In 3000 days of history, I had a 15 million raw data points. The really dumb approach of simply mapping each raw datapoint to a country is waaaaay too slow. Maybe we could do something cleverer like form a small number of clusters (1000?), map each cluster to a country and then use that to label raw points? It could work, but it’s not foolproof by any means and relies on a complex algo. I’m a lazy fucker who hates complexity so I decided to think some more before going down this route.
Exploiting Timeline gaps: The approach I took was to use the fact that the data is already naturally clustered - As I stated earlier, the worldline is discontinuous whenever my cellphone is not online and these gaps cluster the raw data in a natural way - The insight is to realise that most country changes occur during such gaps. This is because:
- I mostly travel between countries by flight - This is specially true for travel in and out of the UK.
- There is a gap in my location history while I’m flying as data connectivity is lost (I never access WiFi on the plane, not sure how this would be affected if I did).
Now there will obviously be some discontinuities which were not travel related - Maybe my phone ran out of battery, or I didn’t have connectivity, but that’s OK - By focussing just on the timeline gaps, we massively reduce the number of points we need to reverse map. We can further cut down the points by prioritizing the biggest gaps first.
Final Approach: So what I did is
- Evaluate the physical distance between consecutive points in the worldline (I used the Haversine metric, just to show off more than anything else).
- Reverse-sorted and got the consecutive worldline points with the largest distance between them. These are the gaps.
- Applied a sensible threshold cutoff - 500 kms seems like a good lower bound for international flights.
- Mapped the remaining few hundred points to coun tries
- Filtered down to the gaps where start_country != end_country
And voila! I had a table of all my international travels.
Comments: This solution works for me (And one other super-lazy friend who I sent my jupyter notebook to) but will the underlying assumptions hold for everyone? Certainly it won’t capture the country changes for Europeans that routinely drive/take trains across country borders. Will it work for the perenially online fucks who check their emails while on international flights? This solution won’t work for a lot of people and that is unsatisfying. On the plus side, it uses the raw data, and the code and logic is extremely simple - The only complicated bit is the country lookup and we outsource that to an API.
Approach 2 - Processed Data only
Chronologically, this was the first approach that I took to solve this problem - In this case I used the semantic data and went through the following steps:
- Isolated the activitySegments tagged as FLIGHTS,
- Looked at the placeVisits before and after those FLIGHT Segments,
- Extracted the airport name from the address of the placeVisits
- Manually compiled a mapping of which airport was in which country.
Comments: This approach was pretty stupid, and I would’ve been better off mapping the start and end locations of the FLIGHT segments using the country lookup. I also spent way too much time at this step figuring out the meaning of random useless fields in the structured data, how they were related to one another and if the data was internally consistent (Was the startTime of each activitySegment AFTER the endTime of the previous activitySegment?)
Other approaches
This idea is obvious enough that a few other people have implemented their own versions of it:
- Laurens Geffert: One of the aforementioned highly talented Google data scientists - His solution is kind of a mix of my 2 approaches - He whittled down the space of points required by focussing on the processed data and then mapped it using a country lookup. I suspect the API he used to do the country lookups was also much more performant than the one I used (I just used whatever ChatGPT recommended). I should add here that, like me, he also performed a sanity check of the results and manually removed a few obviously nonsensical datapoints.
If Laurens has already solved the problem, why blog my solution? Well I could give you reasons like I used a different algorithm or that it’s implemented in python instead of R, but mostly it’s because because Peter Campbell is my spirit animal.

Yeah, you tell 'em Pete!
- Geoprocessing: This company lets you upload your timeline data and then helps you with various analyses. I didn’t want to upload my data anywhere so haven’t experimented with this.
- Mileagewise: They use Google timeline data to create mileage logs (In the US you can claim tax benefits by claiming the mileage incurred while driving around as a business expense) This is a very different usecase from the one considered here, but I threw it in because it’s an ingenious use of timeline data.
Conclusion
The most devastating criticism of the quantified-self subculture is that the projects seldom have tangible value - Pretty graphs that show your travel locations on a map or analytics that count how many cities/countries you visited last month may be interesting, but they are not actionable in any meaningful way. This is why most people don’t bother with the Timeline digest mail that you receive from Google every month - Who gives a fuck?
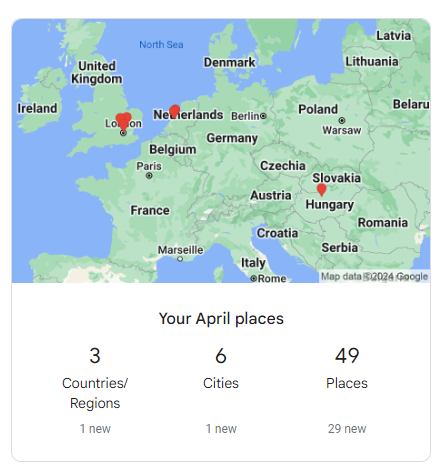
Looks like Google's data scientists exercised as much creativity in designing this digest as the guys who named their geographic data processing company Geoprocessing
This project shows that you can extract value from your personal data in a simple and direct way. As with any project, a quick and dirty first cut will handle 80% of the cases but a solution which addresses all the edge cases presented by all of humanity is beyond the scope of a blog post project hacked together in a few hours. However, I hope that at least a few readers will be able to save a couple of hours of tedious effort by leveraging this code to fill out their own travel history forms!