This is Part III of a 3 part series. Click here for Part I and Part II
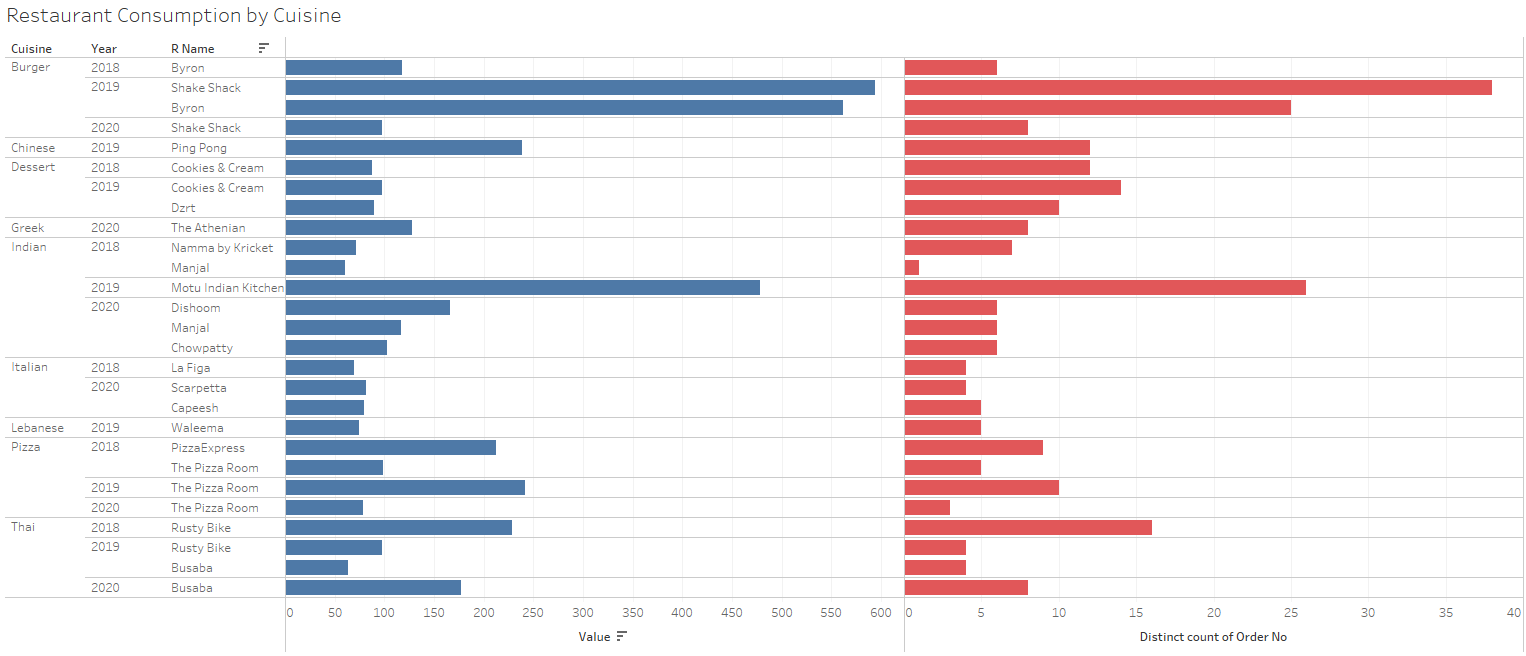
In this section, I want to break down my orders from some of my favourite restaurants and see which items I ordered most, and provide some commentary. I wrap up with some directions for future work.
Table of Contents:
Axes of Interest
What kind of information are we interested in when looking at a particular restaurant?
-
Summary stats: Total number of orders? Total spend on the restaurant? How expensive is the restaurant? How often do I order from the restaurant?
- Dynamic Breakdown: I’d like to see a breakdown of the summary stats over time, since averages don’t always tell the whole story. There are two graphs here:
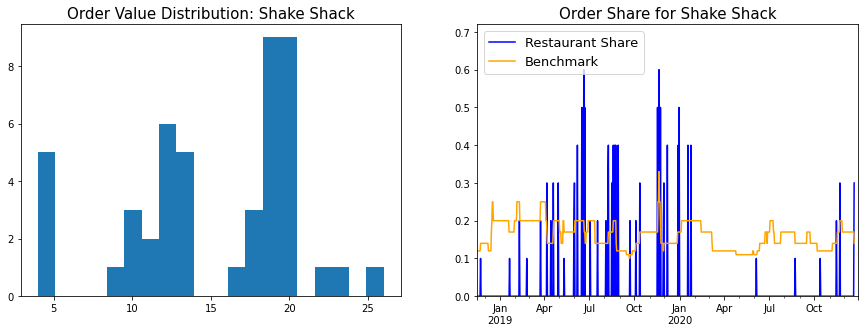
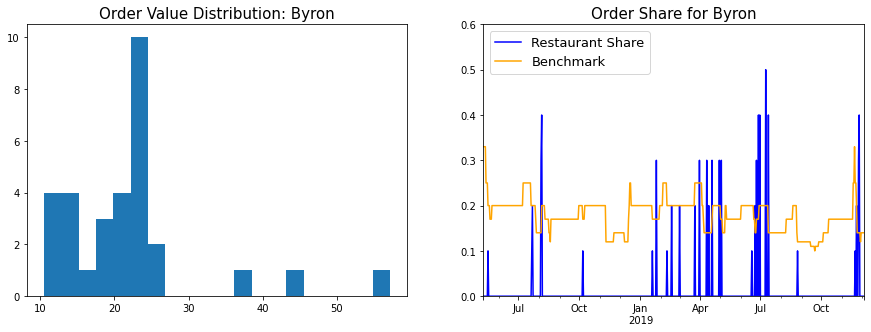
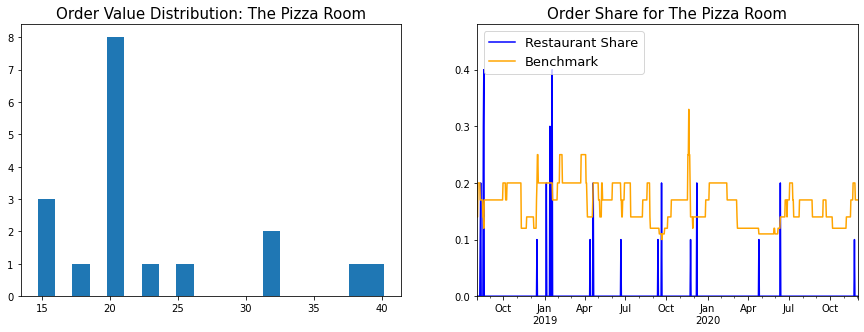
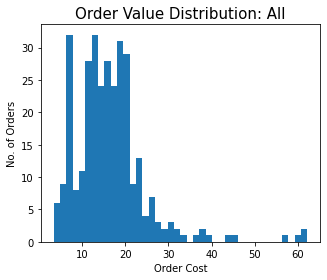
- Histogram of order values: This gives a fair idea of what ordering behaviour was for a particular restaurant - Did I always have the same standard order? Did I order from this restaurant when entertaining guests?
- Chart of order frequency: Each time I ordered from that restaurant, I plotted it’s order share in the last 10 orders. This was benchmarked against 1/(Number of distinct restaurants in last 10 orders) - The logic being that if all restaurants were equally popular, the value of order frequency would be the benchmark value.
- What are the most popular items for this particular restaurant? I’ve also included some personal commentary in this section.
Ever since I decided to try to want to become a datadude, I’ve had an irresistible urge to cluster things together and this seemed like the perfect opportunity. In this sidebar, I describe two different problems that came up in the analysis, and how I approached them with clustering.
Item Categorization - K-Means Clustering
As discussed before, it’s handy to have some way to categorize restaurant items into Mains/Sides/Drinks. It’s a useful axis to view the data along (Most popular Main?), and can also feed into more complicated analyses (How wasteful are you being when you order drinks from the restaurant instead of buying them from the supermarket below your house?)
Probably the most accurate way to do item categorization is to somehow scrape the Deliveroo menus for each restaurant, and look up which category they fall into. I do not have the coding skills required to do this, and even if I did, it probably wouldn’t be as straightforward (Item names change over time, as we will discuss below).
If I can’t get the data from an external source, I have to look within. The only information I have per item is it’s name and it’s price . I don’t know how to extract the category data from the item name, and so I decided to go with a simple binary classification of items per restaurant into Mains or Sides, based on their price. What this boils down to is applying K-Means clustering to a 1-dimensional dataset (The list of prices in this case). I don’t know if K-Means is ideal for such situations, or if there are simpler and more direct methods one can leverage, but it was available in SKlearn library and seemed to give good enough results.
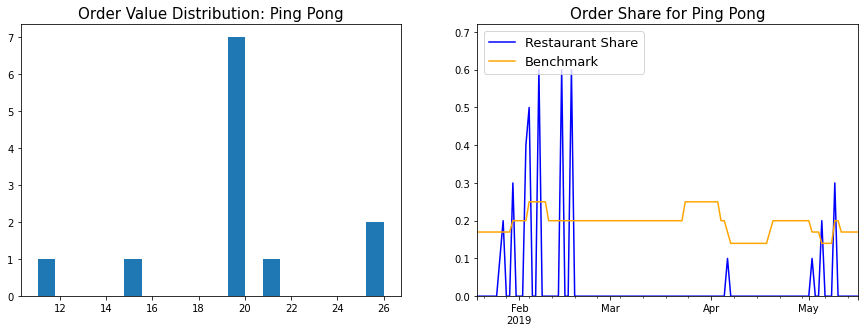
For certain restaurants this kind of binary categorization doesn’t make sense - For eg. Ping Pong has a system of small plates, so all their items are Mains (or Sides). In such a case, forcing a divide into 2 categories creates an artificial distinction. There are ways to determine the correct number of clusters for a dataset, but I don’t have a lot of expertise in these matters and hence decided to just take this as an input from the user.
Item Name Changes - Prefix Clustering
When analysing the distribution of items per restaurant, I found that items names will sometimes change over time. Example: Shake Shack will sometimes refer to it’s “Chipotle Cheddar Chick’n Burger” as just “Chipotle Cheddar Chick’n”, and the name of Ping Pong’s “Potato and Edamame Cake (V) (2pcs)” changed one day to “Potato and Edamame Cake (v) (2pcs)”.
Name changes like these can lead to some nasty surprises; Can you imagine my horror when I saw “Garden Fresh Golden Dumplings” topping the Ping Pong list instead of my beloved cakes of potato and edamame?!
This is similar to the issue I faced earlier in the analysis with restaurant names, but solving this with manual relabelling is far more tedious, since the universe of items is much larger.
My first thought was to define the distance between two items as the edit distance, connect all points (i, j) in the resulting graph with distance(i, j) <= d (For some suitable d) and then each connected component would be defined as a separate cluster. You could then define some appropriate point inside the cluster as the representative (The centroid maybe?) However, it didn’t feel like this problem was worth that much effort.
The next version of this idea was to draw a directed edge from i -> j if lowercase(i) is a prefix of lowercase(j). If lowercase(i) == lowercase(j), we use a lexicographic ordering to break a tie and avoid cycles. This sets up a directed acyclic graph over the items, and we can again define connected components as clusters. The lowest common prefix of all the strings in the cluster pretty much presents itself as the natural candidate for cluster representative.
This kind of clustering seems to work quite well for my dataset and didn’t seem to cluster any distinct items together. However, as a future improvement, it might be a good idea to also consider the average item price as a co-ordinate when evaluating the distance - If the item is the same, the price will be similiar as well.
Shake Shack
Shake Shack is my favourite restaurant, and with 47 orders, the data supports this. I first discovered it in the US and fell in love with their cheesy fries (As we will see, the data supports this as well).
Summary Stats
Consumption:
Total Number of Orders: 47
Total Value of Orders: £707.4
Cost:
Average Order Value: £15.05
Median Order Value: £17.45
Order History:
First Order: 2018-11-22
Last Order: 2020-12-21
Order Frequency: 1.86 per month
Summary Graphs
Item-wise Analysis
Next up I looked at the distribution of the items.
| Item |
Qty |
Value |
Avg Price |
Item Type |
| Crinkle Cut Fries with a pot of Cheese Sauce (V) |
45 |
180.00 |
4.00 |
Side |
| Shack Cheese Sauce |
21 |
21.00 |
1.00 |
Side |
| Chocolate |
21 |
124.95 |
5.95 |
Main |
| Chick'n Shack |
16 |
120.00 |
7.50 |
Main |
| Chipotle Cheddar Chick'n |
14 |
119.00 |
8.50 |
Main |
| Black Truffle Chick'n |
7 |
66.50 |
9.50 |
Main |
| Fries (V) (VG) |
5 |
15.00 |
3.00 |
Side |
As is evident, I am a huge fan of the cheesy fries, and an even bigger fan of the cheese sauce that they serve along with it - Counting the default serving you get with the fries along with the extra servings, that’s 76 pots of cheese sauce! This makes sense, because having to ration cheese sauce (Or worse, share it) is an abominable thought. If there was ever any doubt, I’d order an extra serving. At a price of £1, it was a steal - Though the caloric cost (240 kcal) is much higher.
The K-Means clusterer has categorized the Chocolate Shake as a Main based on the £5.95 price point, but given that this is Shake Shack we’re talking about, it’s probably OK.
My relation with their burgers has evolved over time; At first I could only eat the Shroom burger, which kinda sucked. I was hugely excited about the launch of their fried chicken sandwich, which did not disappoint (At first). Over time though, it started tasting super dry and chewy, and whenever they came out with a special edition chicken burger (Like the Chipotle Cheddar Chick’n, or the Black Truffle Chick’n) I’d immediately switch loyalties. I’m still not sure why the special edition burgers tasted so much better; My theory about the Black Truffle Chick’n is that it was made of thigh meat, which meant a juicier and more tender patty. While the data doesn’t reflect this, recently life came full circle for me when I switched back to the Shroom burger.
Byron
Byron clocks in at number 2 in terms of all-time favourites, though I’m not sure when I’ll eat there next. The pandemic seems to have hit this chain particularly hard. Most outlets haven’t re-opened, and of the ones that have, none deliver to my house. They’ve also booted my favourite items from their new menu, so don’t know if I’ll go back at all.
For old time’s sake then, here are the Byron stats:
Summary Stats
Consumption:
Total Number of Orders: 31
Total Value of Orders: £679.3
Cost:
Average Order Value: £21.91
Median Order Value: £20.65
Order History:
First Order: 2018-05-16
Last Order: 2019-11-27
Order Frequency: 1.66 per month
Summary Graphs
Item-wise Analysis
| Item |
Qty |
Value |
Avg Price |
Item Type |
| Blue Cheese Sauce |
26 |
36.9 |
1.42 |
Side |
| Onion rings (V) |
19 |
76.0 |
4.00 |
Side |
| Chocolate |
16 |
80.0 |
5.00 |
Side |
| V-Rex + Fries |
14 |
190.0 |
13.57 |
Main |
| Classic Chicken |
12 |
143.0 |
11.92 |
Main |
| Byron Lager (500ml) |
8 |
47.6 |
5.95 |
Side |
| Sriracha Mayonnaise (V) |
4 |
5.8 |
1.45 |
Side |
The item distribution is almost exactly the same as Shake Shack (Fries don’t feature on the list, as Byron would provide them with the burger).
Cheese Sauce at the top of the pile again! Dunking their large, messy beer-battered onion rings into the Blue cheese sauce, adding a touch of mustard and then devouring the result was a ritual I’d perform every single time. The Byron Chocolate Shake was also amazing (Much better than Shake Shack).
On the burgers, I actually really like their classic grilled chicken burger, both in terms of the flavour, and the health angle - It was the leanest burger among all the burgers in this analysis. The V-Rex was a special edition vegetarian burger, that is probably the closest I’ve seen UK veg burgers come to the veg burgers we have in India (It had a crunchy deep-fried patty, spicy mayo and and a slice of onion in it).
Speaking of the V-Rex reminded me of one my biggest pet peeves - Why isn’t anyone making veg burgers out of potatos? If there are any English restaurant owners reading this, ditch the halloumi/beans/jackfruit/Beyond Meat patties, and use potatos instead!! I don’t know why no one has come up with this yet, but a smattering of vegetables in a matrix of mashed potatos, breaded and deep-fryed, results in the tastiest vegetarian burgers. Put this on your menu and you will win a lot of business and goodwill from the large (And rapidly growing) Indian immigrant community.

Also, people whose girlfriends are vegetarians, which pretty much makes them vegetarians.
Ping Pong
Ping Pong was the first restaurant I ever ate at in London. I’ve always enjoyed momos, springrolls and assorted dimsums, and Ping Pong elevated that whole experience into something very special. Unfortunately I only lived within the Ping Pong delivery radius for a small window in space-time, otherwise it would be a serious contender for the top spot.
Summary Stats
Consumption:
Total Number of Orders: 12
Total Value of Orders: £238.25
Cost:
Average Order Value: £19.85
Median Order Value: £19.95
Order History:
First Order: 2019-01-26
Last Order: 2019-05-09
Order Frequency: 3.5 per month
Summary Graphs
Item-wise Analysis
| Item |
Qty |
Value |
Avg Price |
| Potato and Edamame Cake (v) (2pcs) |
12 |
41.40 |
3.45 |
| Mixed Vegetable Spring Roll (v) (3pcs) |
8 |
30.00 |
3.75 |
| Spicy Vegetable Dumpling (v) (gf) (3pcs) |
8 |
30.80 |
3.85 |
| Golden Dumpling (v) (gf) (3pcs) |
7 |
26.25 |
3.75 |
| Vegetable Sticky Rice (v) |
6 |
30.90 |
5.15 |
| Chinese Vegetable Spring Roll (V)(VG) |
4 |
15.00 |
3.75 |
| Spinach and Mushroom Dumpling (3pcs) (VG) (GF) |
4 |
15.40 |
3.85 |
| Spicy Chinese Vegetable Dumpling (V) (VG) (GF) (3pcs) |
3 |
11.55 |
3.85 |
| Asahi |
2 |
9.30 |
4.65 |
The Ping Pong item list shows some of the limitations of the prefix clustering approach used to cluster item names. The “Mixed Vegetable Spring Roll” and “Chinese Vegetable Spring Roll” are the same, as are the “Spicy Vegetable Dumplings” and the “Spicy Chinese Vegetable Dumplings”. On making these corrections, it looks like I ordered the potato cakes and spring rolls 12 times in 12 orders (And spicy veg dumplings 11 times), so pretty much every time I ordered. The uniform order hypothesis is also supported by the order value histogram.
Not much too say about these items; Just extremely tasty, high quality dimsums that always left me happy and satisfied. How I wish they’d open up a few dark kitchens!
The only thing that irritates me about this table is that I paid £9.30 for two bottles of Asahi, when I could’ve bought 4 bottles from Tesco for £5.50. Paying for drink markups is understandable when you’re dining at the restaurant, but it’s foolish when you get food delivered at home!
Rusty Bike
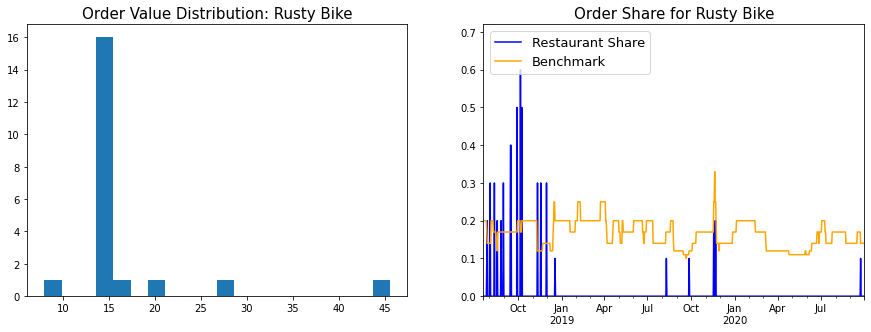
Rusty Bike was my go-to place when I first moved to London. Unlike most delivery options, the food was not extravagant/unhealthy, reasonably priced and quite tasty.
Summary Stats
Consumption:
Total Number of Orders: 21
Total Value of Orders: 346.1
Cost:
Average Order Value: 16.48
Median Order Value: 14.15
Order History:
First Order: 2018-07-27
Last Order: 2020-09-23
Order Frequency: 0.8 per month
Summary Graphs
Item-wise Analysis
| Item |
Qty |
Value |
Avg Price |
Item Type |
| Green Curry |
21 |
204.85 |
9.75 |
Main |
| Steamed Rice |
15 |
42.85 |
2.86 |
Side |
| Vegetable Spring Rolls |
12 |
54.20 |
4.52 |
Side |
As is evident from the price histogram, Rusty Bike orders followed a standard template - Green Curry, Steamed Rice, and on occassion, spring rolls. It is a bit odd that the numbers don’t line up better - I’d expected the Green Curry and Rice orders to be almost equal. On reviewing the raw orders data, I found that initially (For the first six orders), Rusty Bike used to include a default steamed rice with the green curry. They later decoupled them into separate items. One result of this is that the Average Price of the green curry in the table above is inflated - The actual price of the green curry is about £7.5.
The Pizza Room
I have eaten a lot of pizza in my life and The Pizza Room is something special.
Summary Stats
Consumption:
Total Number of Orders: 18
Total Value of Orders: £419.54
Cost:
Average Order Value: £23.31
Median Order Value: £20.94
Order History:
First Order: 2018-08-10
Last Order: 2020-11-25
Order Frequency: 0.64 per month
Summary Graphs
Item-wise Analysis
| Item |
Qty |
Value |
Avg Price |
Item Type |
| Quattro Formaggi |
20 |
299.20 |
14.96 |
Main |
| Brownie with Ice Cream |
9 |
56.25 |
6.25 |
Side |
| Coke 330ml |
3 |
7.80 |
2.60 |
Side |
| Margherita |
2 |
24.30 |
12.15 |
Main |
Wherever I go, the Quattro Formaggi or 4 Cheese pizza has been my go-to pizza order for a while. What makes the Pizza Room Quattro Formaggi special is:
-
Tomato Sauce: Nowhere else have I seen Pizza Room levels of clarity on this topic. They are upfront about the fact that the default option is no tomato sauce (Traditionally, the QF is a ‘White Pizza’). However, if you’d like tomato sauce, they will add it on for a fee. I really like the fact that they charge me a nominal amount for the sauce and hence eliminate the uncertainty - At other pizzerias, I add an awkward delivery note saying “If you don’t typically add tomato sauce to the Quattro Formaggi pizza, please can you do so in this case?” and then pace nervously till the pizza gets delivered.
-
Add-Ons: Definitely add green chillies to your QF pizza for a zingy complement to all the cheese.
-
Generous deposits of Gorgonzola: I’ve no idea why, but a lot of restaurants scrimp on the blue cheese. The Pizza Room isn’t one of them.
Again, we see the idiocy of paying >3x for a can of Coke, that could’ve been fetched from my refrigerator.
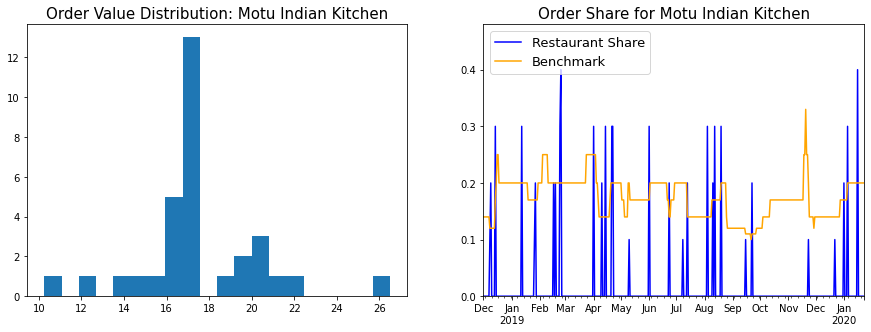
Motu Indian Kitchen
Motu translates to “Fatty” or “Fatboy”, and they have shipped me a lot of calories.
Summary Stats
Consumption:
Total Number of Orders: 32
Total Value of Orders: £565.75
Cost:
Average Order Value: £17.68
Median Order Value: £17.5
Order History:
First Order: 2018-12-08
Last Order: 2020-01-16
Order Frequency: 2.38 per month
Summary Graphs
Item-wise Analysis
| Item |
Qty |
Value |
Avg Price |
Item Type |
| Box for 1 |
28 |
506.0 |
18.07 |
Main |
| Tadka Dal (VG) |
9 |
31.5 |
3.50 |
Side |
| Pilau Rice (V) |
7 |
17.5 |
2.50 |
Side |
On paper, the Box for 1 had everything I could want from an Indian meal: Paneer, Dal Tadka, garlic naan and papads. The quality was not amazing, but it wasn’t too bad, and beggars can’t be choosers.
Eagle-eyed readers will notice that this table is not consistent with the order value histogram above - The Box for 1 costs £18.07, but there are no orders with that price. Maybe the price increased over time? But in that case you’d probably have a bimodal distribution with two peaks. What gives? In order to crack this one, I had to go back all the way to the email receipts.
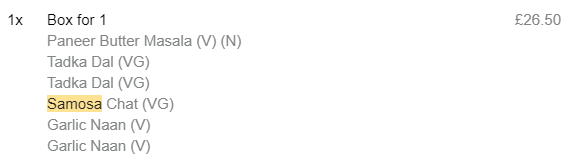
Turns out Motu will let you add extra food to your Box for 1 order, and the Deliveroo email receipt lists it all under the Box for 1. I didn’t account for this case while writing my email parser (And I’m not sure how I should, since the unit prices of the individual items aren’t given). Hence the £18.07 is a an average of the vanilla, no-frills-attached Boxes for 1 and the fancier, with-extra-fixin’s Boxes for 1, like the one below.
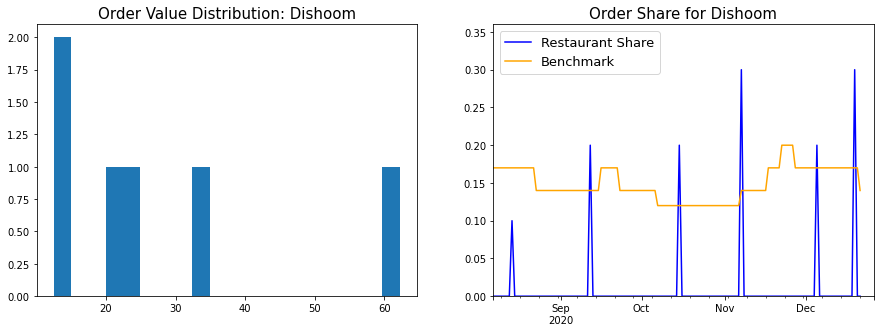
Dishoom
A lot of people love to shit on Dishoom. These are the fools that equate contrarianism with intelligence. Dishoom is fucking amazing, and I’ll fight anyone who says otherwise.
Summary Stats
Consumption:
Total Number of Orders: 6
Total Value of Orders: £166.2
Cost:
Average Order Value: £27.7
Median Order Value: £21.9
Order History:
First Order: 2020-08-14
Last Order: 2020-12-19
Order Frequency: 1.42 per month
Summary Graphs
Item-wise Analysis
| Item |
Qty |
Value |
Avg Price |
Item Type |
| Garlic Naan (V) |
10 |
35.0 |
3.50 |
Side |
| House Black Daal (V) |
6 |
51.9 |
8.65 |
Main |
| Chilli Chicken |
4 |
27.6 |
6.90 |
Side |
| Pau Bhaji (V) |
1 |
5.7 |
5.70 |
Side |
| Chole (Ve) |
1 |
9.5 |
9.50 |
Main |
| Mattar Paneer (V) |
1 |
11.5 |
11.50 |
Main |
| Chicken Berry Britannia |
1 |
12.5 |
12.50 |
Main |
| Chicken Ruby |
1 |
12.5 |
12.50 |
Main |
Dishoom has the best naan I’ve had in the UK, just by virtue of the fact that it’s actually a naan, and not an insipid cloud of semi-cooked dough. The black daal is among the best I’ve had anywhere, but my favourite item has to be the Chilli Chicken, which is basically popcorn chicken tossed in a sticky, spicy sauce. Dishoom, if you guys are reading this, how about showing vegetarians some love and adding Chilli Paneer to the menu?
Next Steps
The following are some ideas for next steps:
-
Add support for UberEats: I’m primarily a Deliveroo user myself, but I did go through an UberEats phase. Would be nice to get that data in here as well.
-
Calorie counts: I would really like to be able to figure out caloric consumption rates, but I’ve no idea how I’d go about it.
-
Infer regime changes from the data. As seen in the analysis above, the data often changed due to events taking place in my life and the world in general. I would like to be able to automatically infer the different regimes from the data in some way. In a high-level, abstract sense, the way to do this would be to fit some kind of model to the data in the current phase, and calculate the probability of the next phase occurring given that fit. If the probability is low, that means an event has occurred which caused the fit to change. I have no idea what such a model would actually look like though.
-
Correlate this with other datasets in my life: Was I on a health kick when I didn’t order in those 2 weeks in Jan? Did I order that brownie sundae late on Friday night because I had an extra long day at work? What do I typically watch on TV when eating Shake Shack?
-
Get everyone else’s data: Wouldn’t it be awesome if everyone in London ran the parser and uploaded their spreadsheets into a central repository? We could mine the resulting dataset for insight into how all of London eats. We could charge restaurant owners and investors to run queries on the dataset, or sell them insights that are mined from it. For eg. “Guys, Chilli Chicken is super popular right now, you gotta add it to your menu!” Or how about “Guys this hole-in-the-wall type place in Brixton is really blowing up, maybe we should invest and hook them up with a location in Central London?”.
If Deliveroo ever opens up a restaurant consultancy, remember, you saw it here first!
-
Look at the other players in the Deliveroo ecosystem: What about the riders? Would they get some benefit out of analysing their delivery data? Comparing their stats against other riders, or the population average? I don’t know how much data Deliveroo shares with them, and in what format, but employers are typically incentivized to give their employees as little information as possible.
]]>


Comments
This was both super impressive and super entertaining! Did you do any validation of the records to see how accurate the OCR+parsing was? I’d be curious to know how well it worked :)
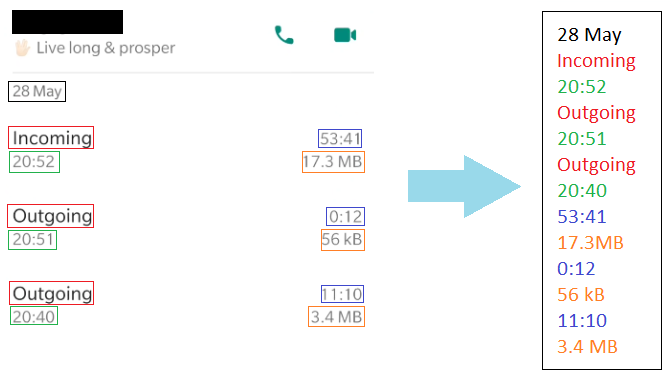
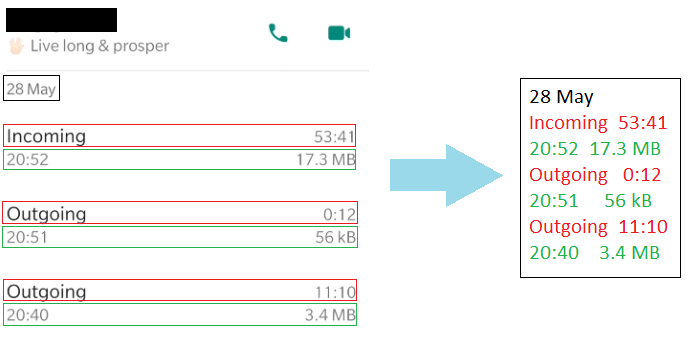
Good problem solving skills never thought of mirroring phone screen and integrating it with OCR
Wow wow wow, hard to stop reading this one, once you have fallen into start reading trap.
Well written, data dude. Look forward to the gossip in the next post
That was entertaining and enlightening - A much more interesting project would be pdf parsing btw.. especially to extract tabular data.
Pdf parsing is much easier and much less interesting
Really fun read, Rube Goldberg contraptions are fun, especially if there are no moving parts to fail. Perhaps a solution to regularly updating the call logs is to have an applet that triggers when you put your phone to charge at night, putting your phone into airplane mode, and then start logging.
Enlarging the font size was a good hack to get over the limitations of OCR
Woaah…never thought there could be so much to call logs on WhatsApp. Good analysis and witty humour. Kudos to the effort! All in all in a good read
Super fun read 😁 Had to read the sidebar twice 😂
Moar plz